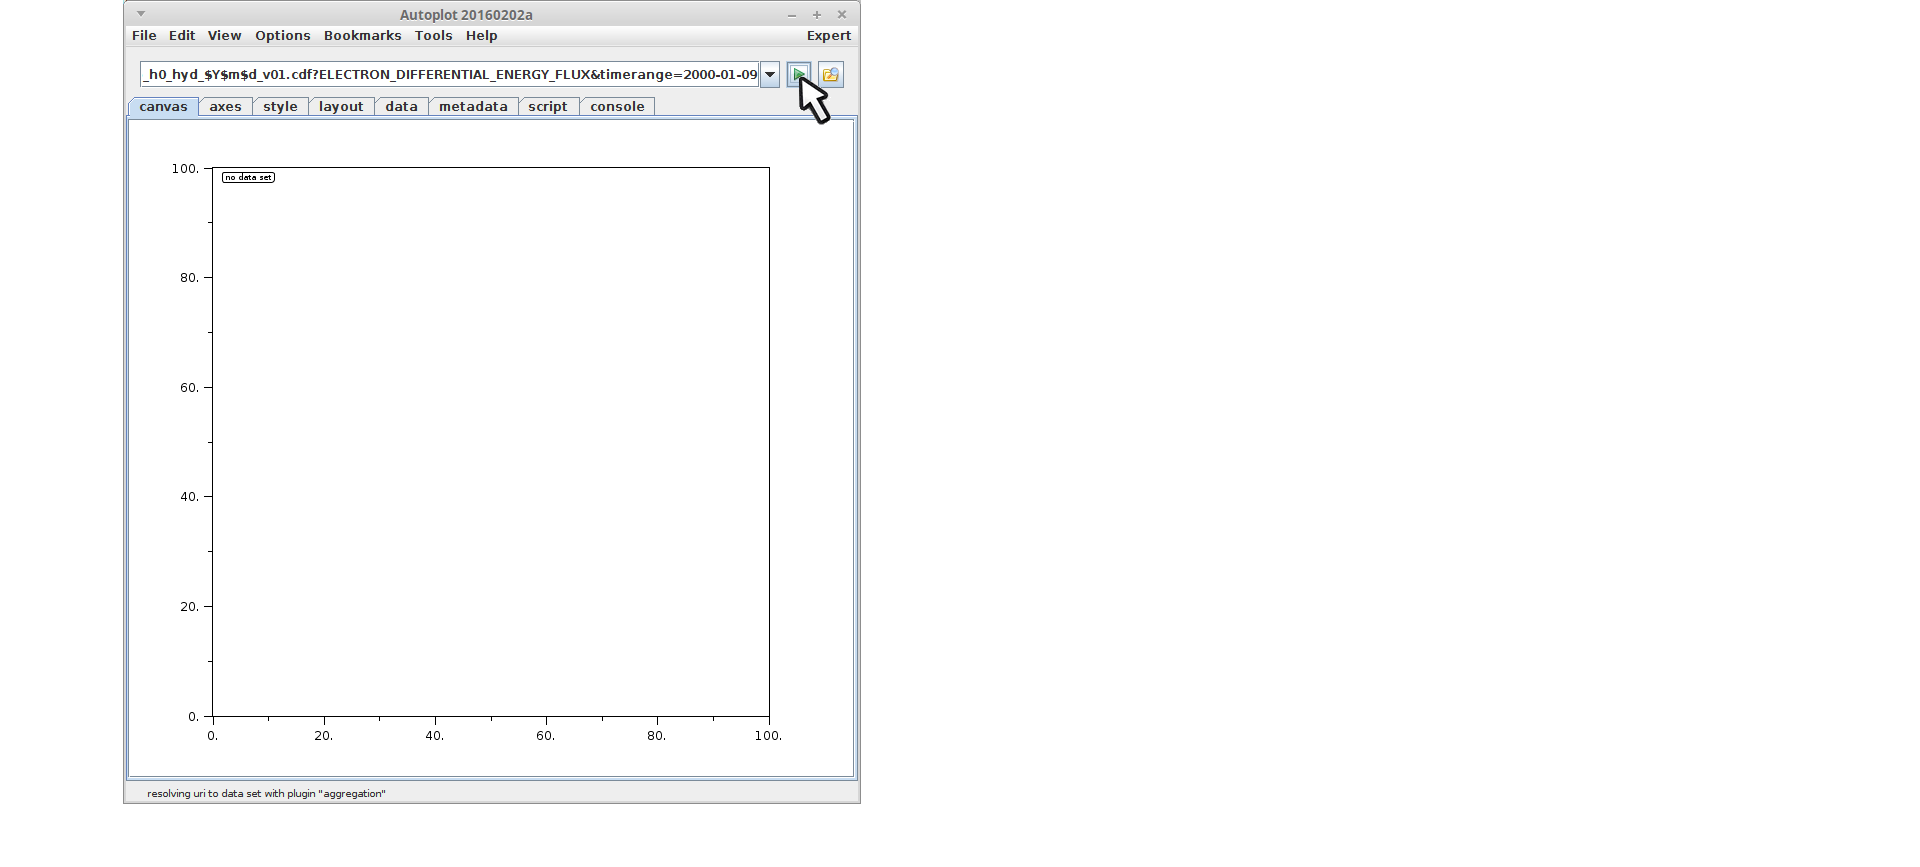
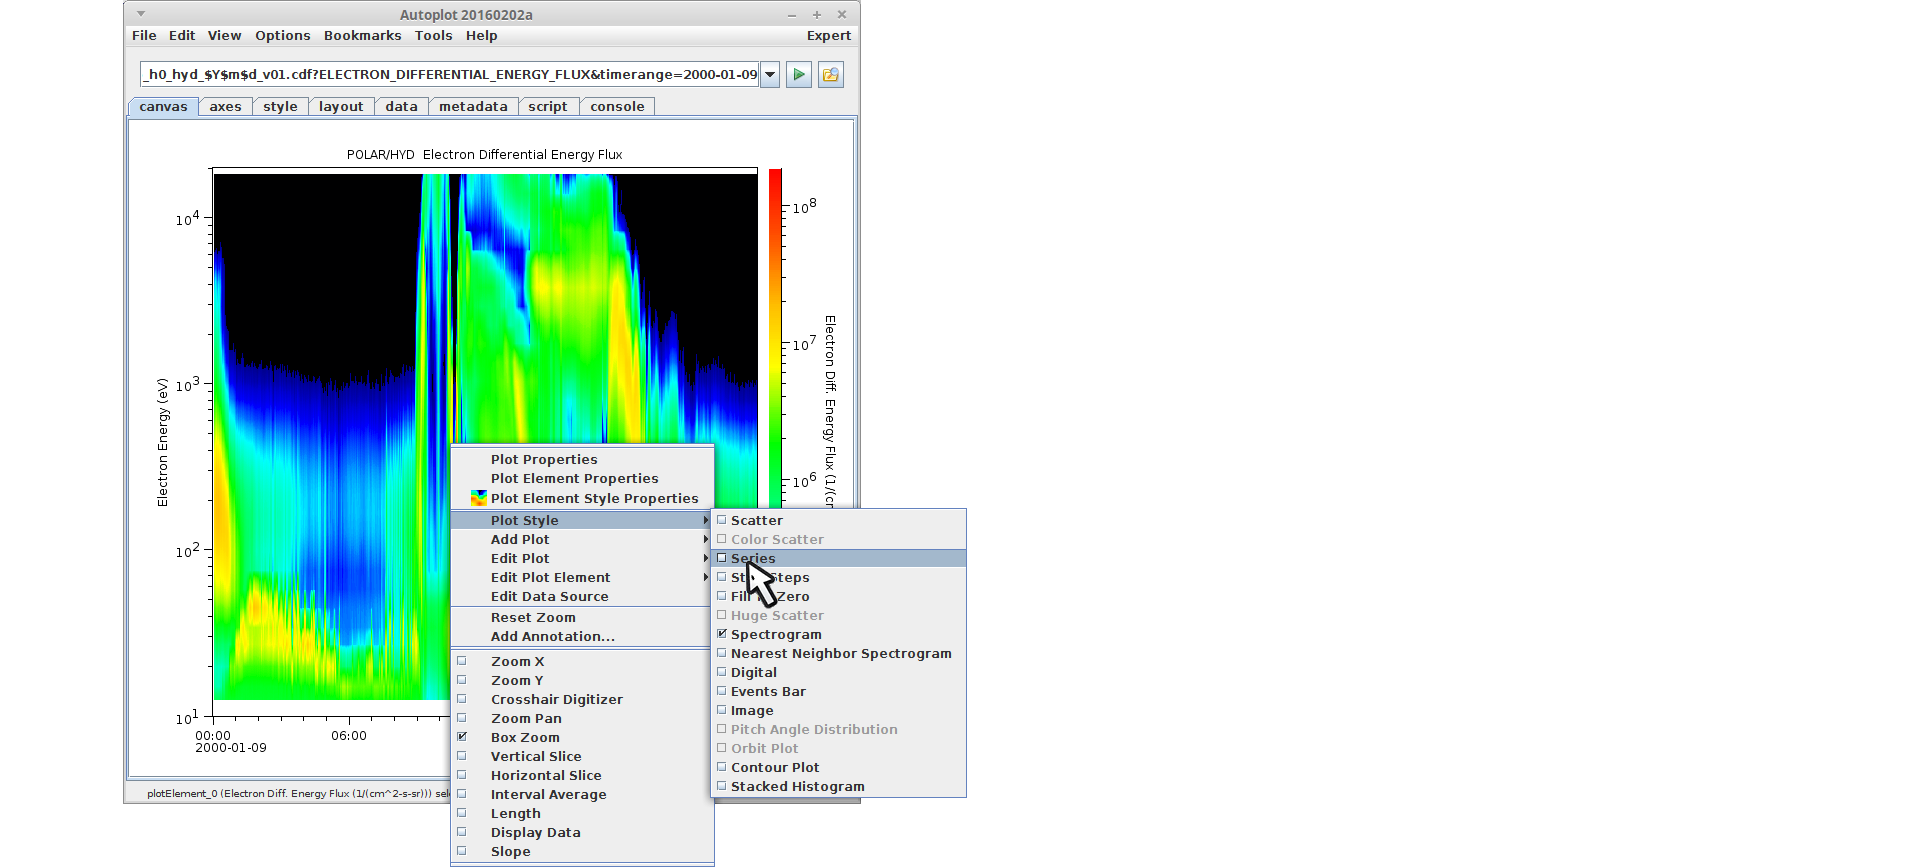
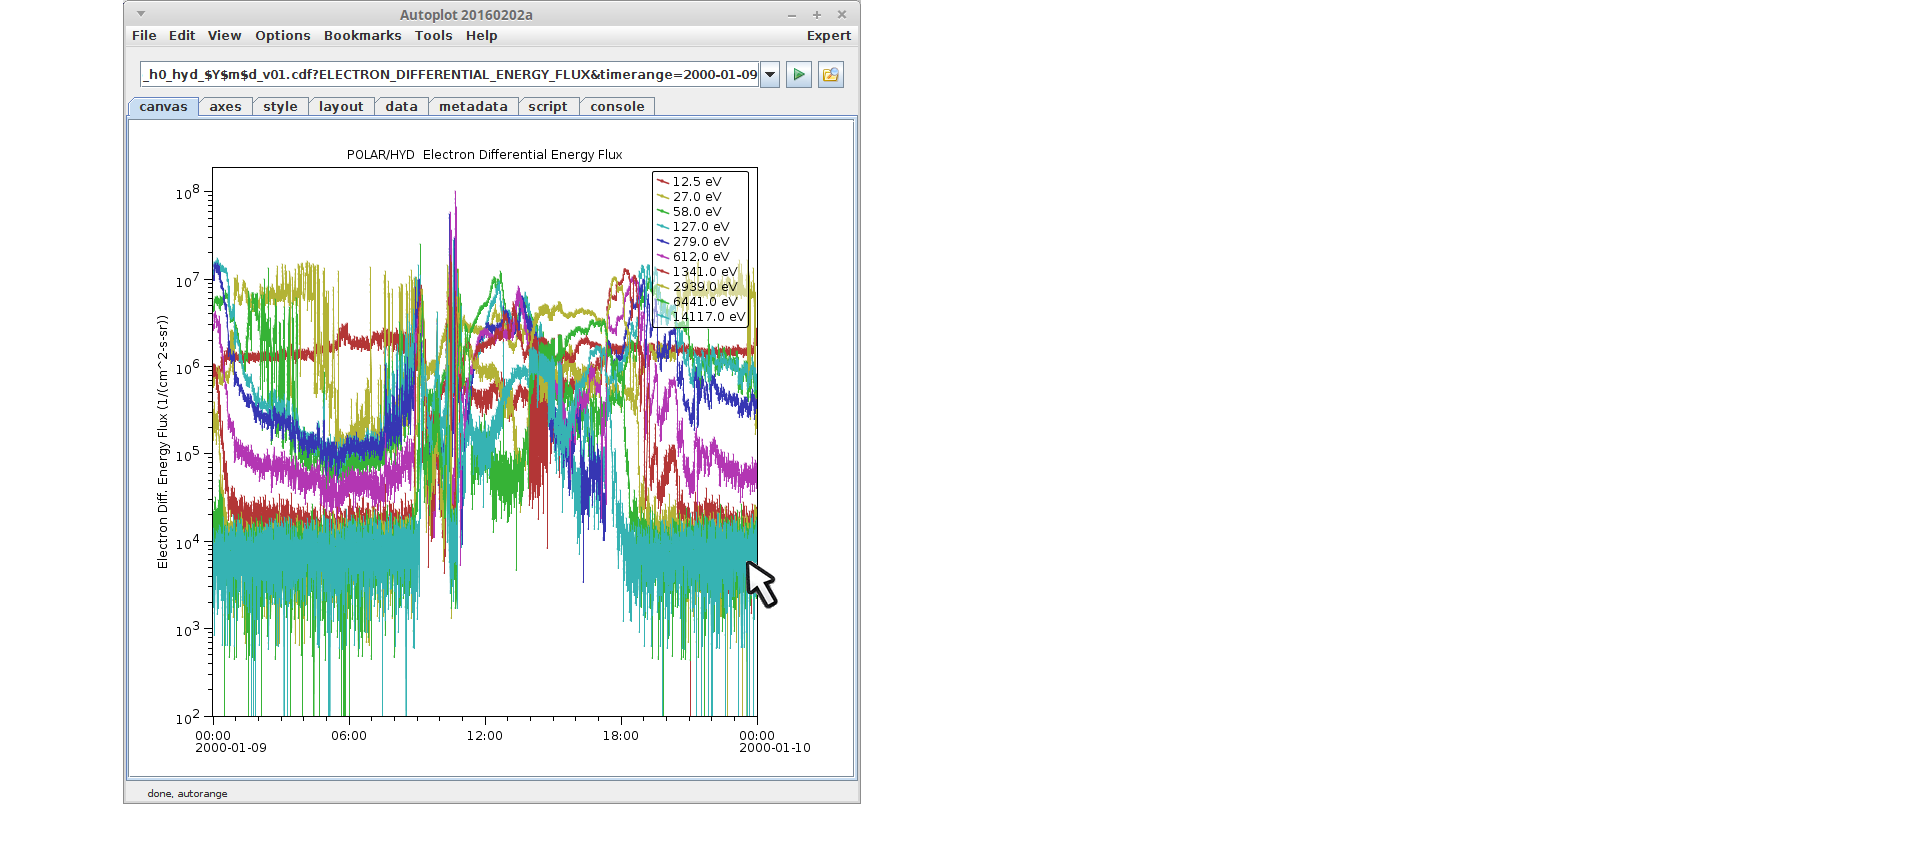
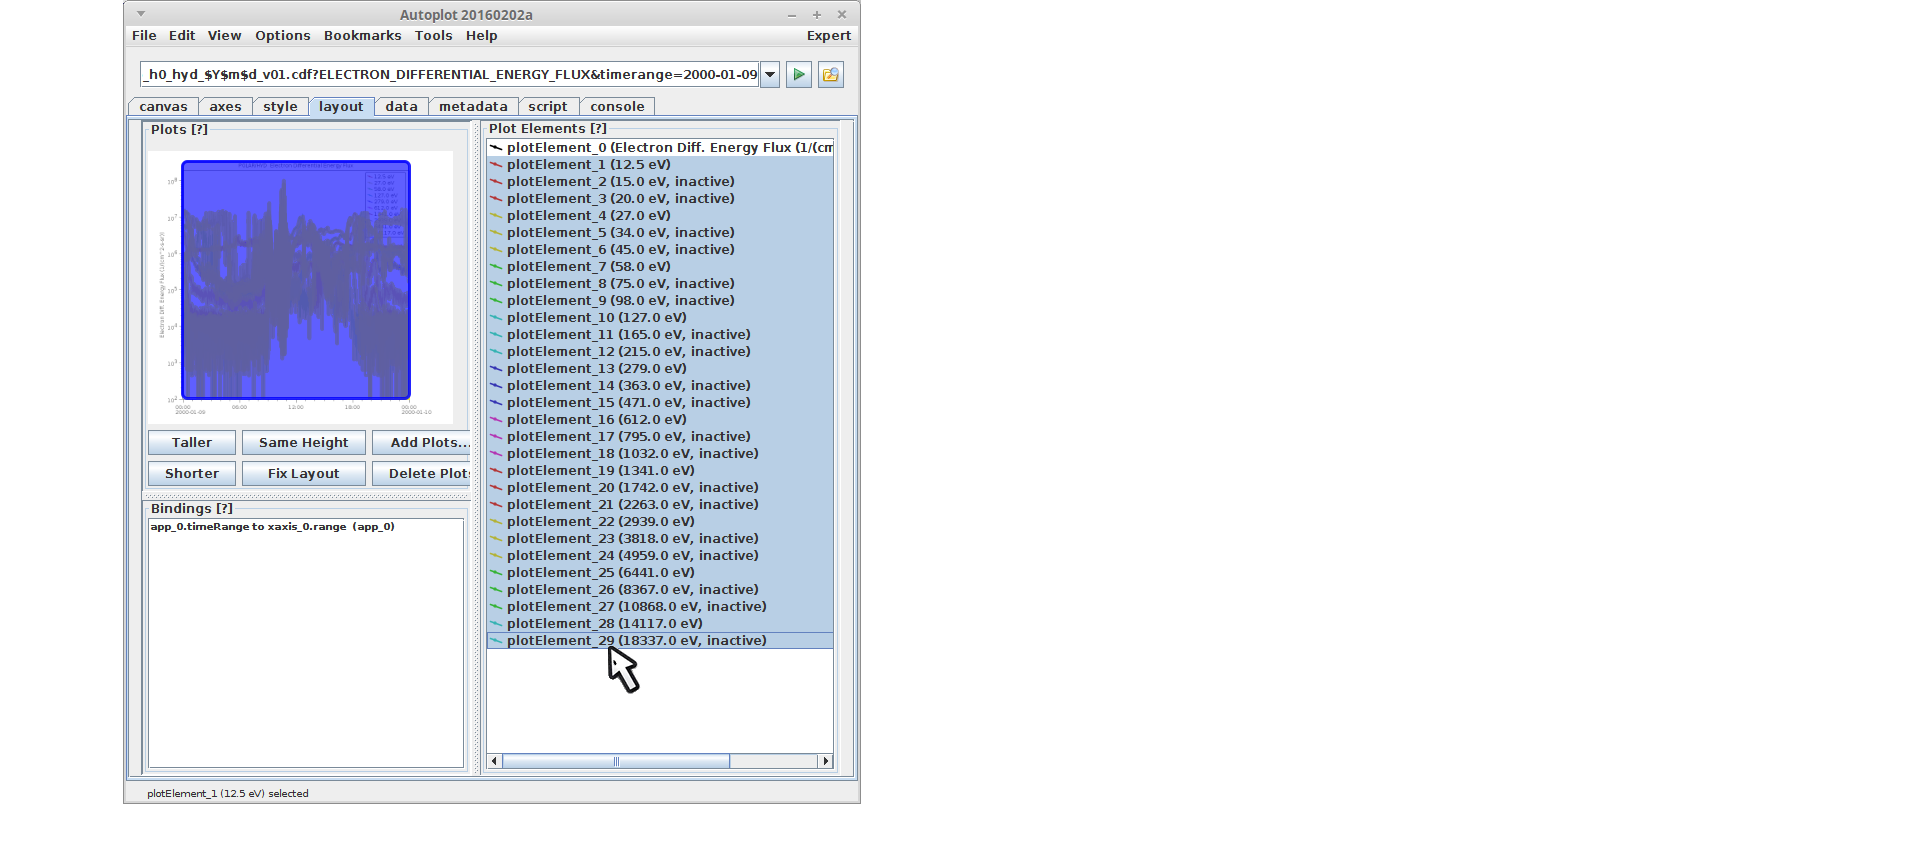
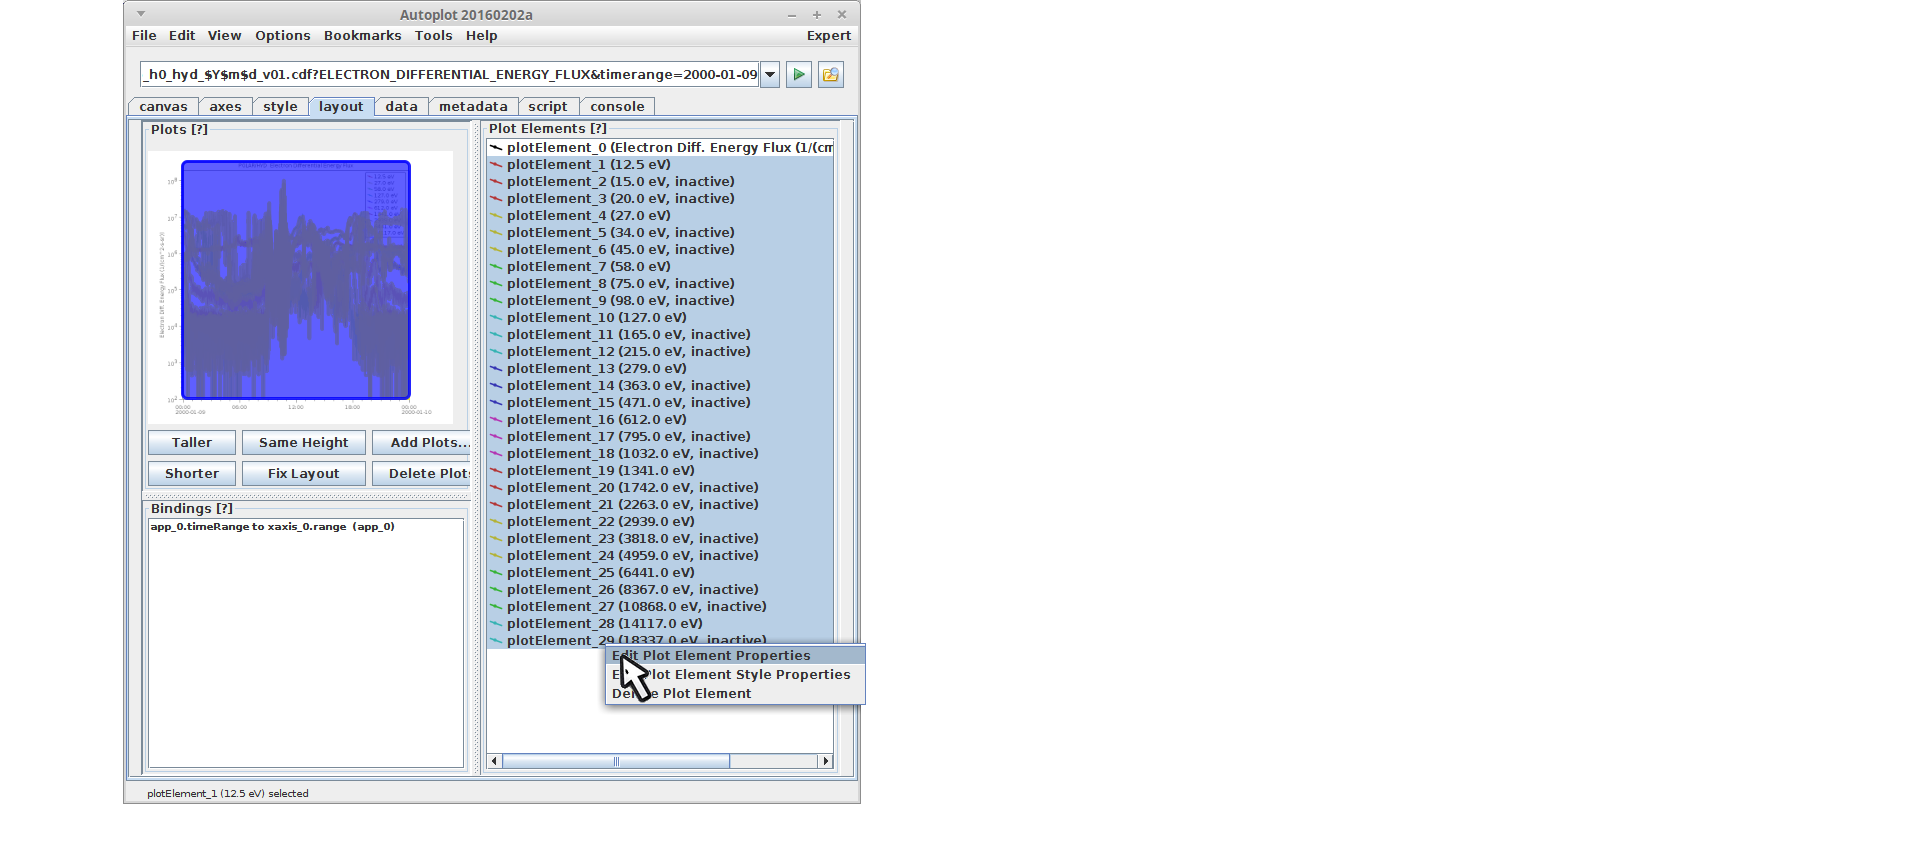
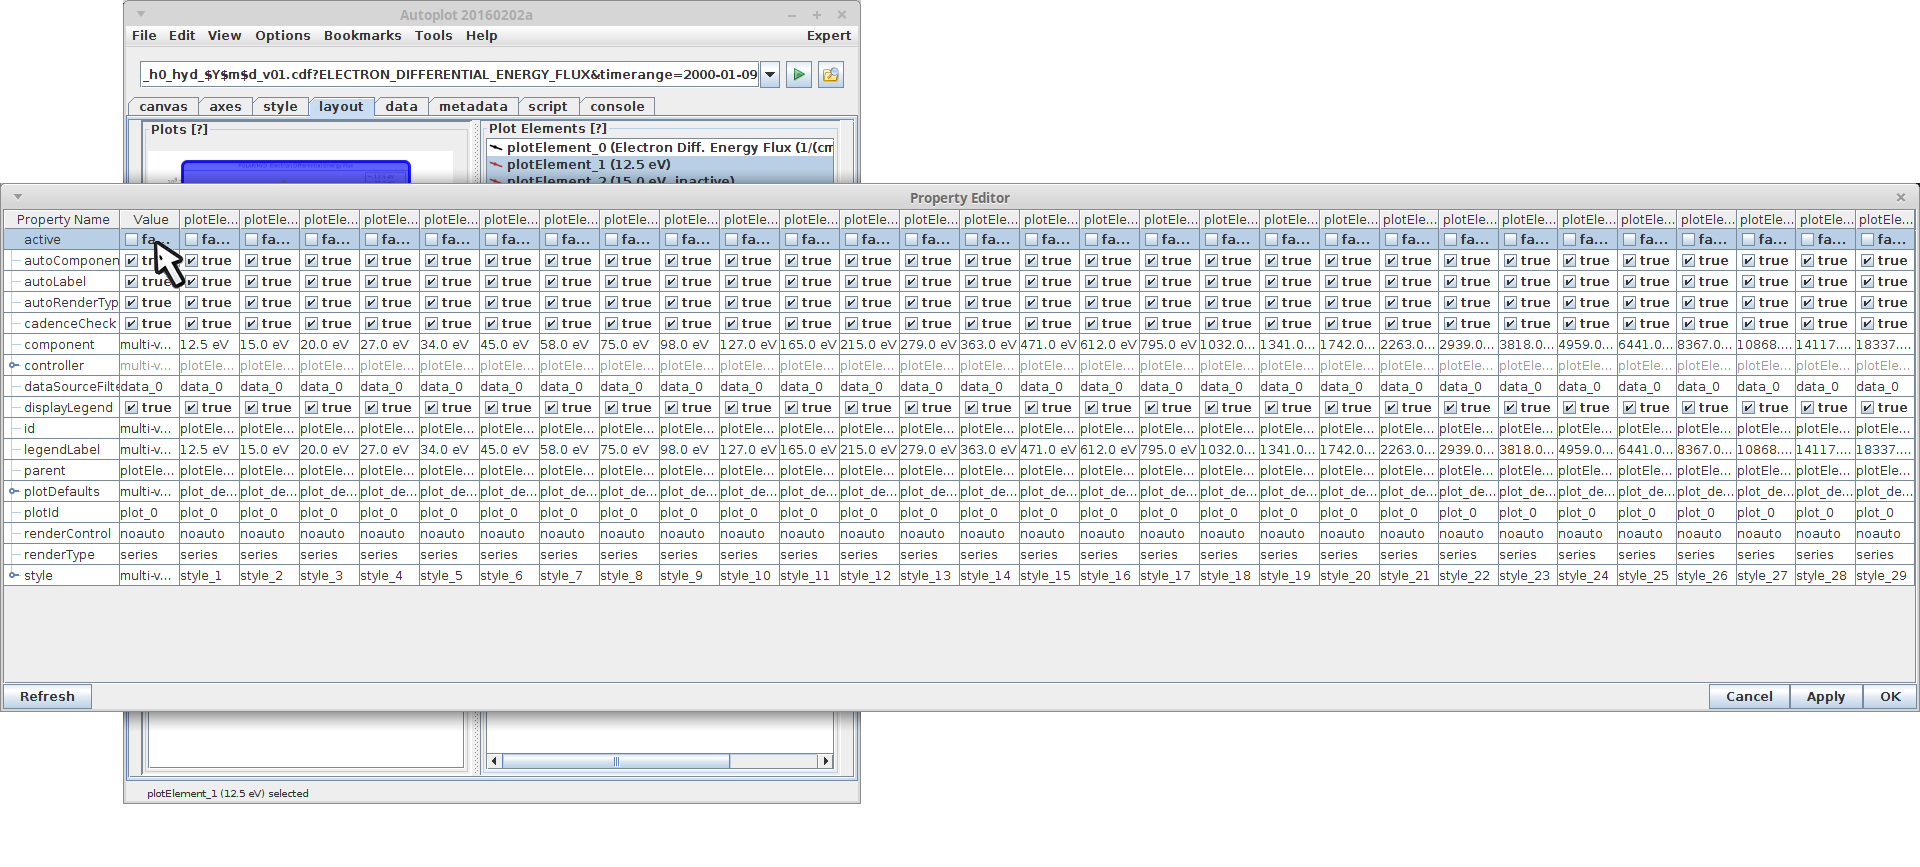
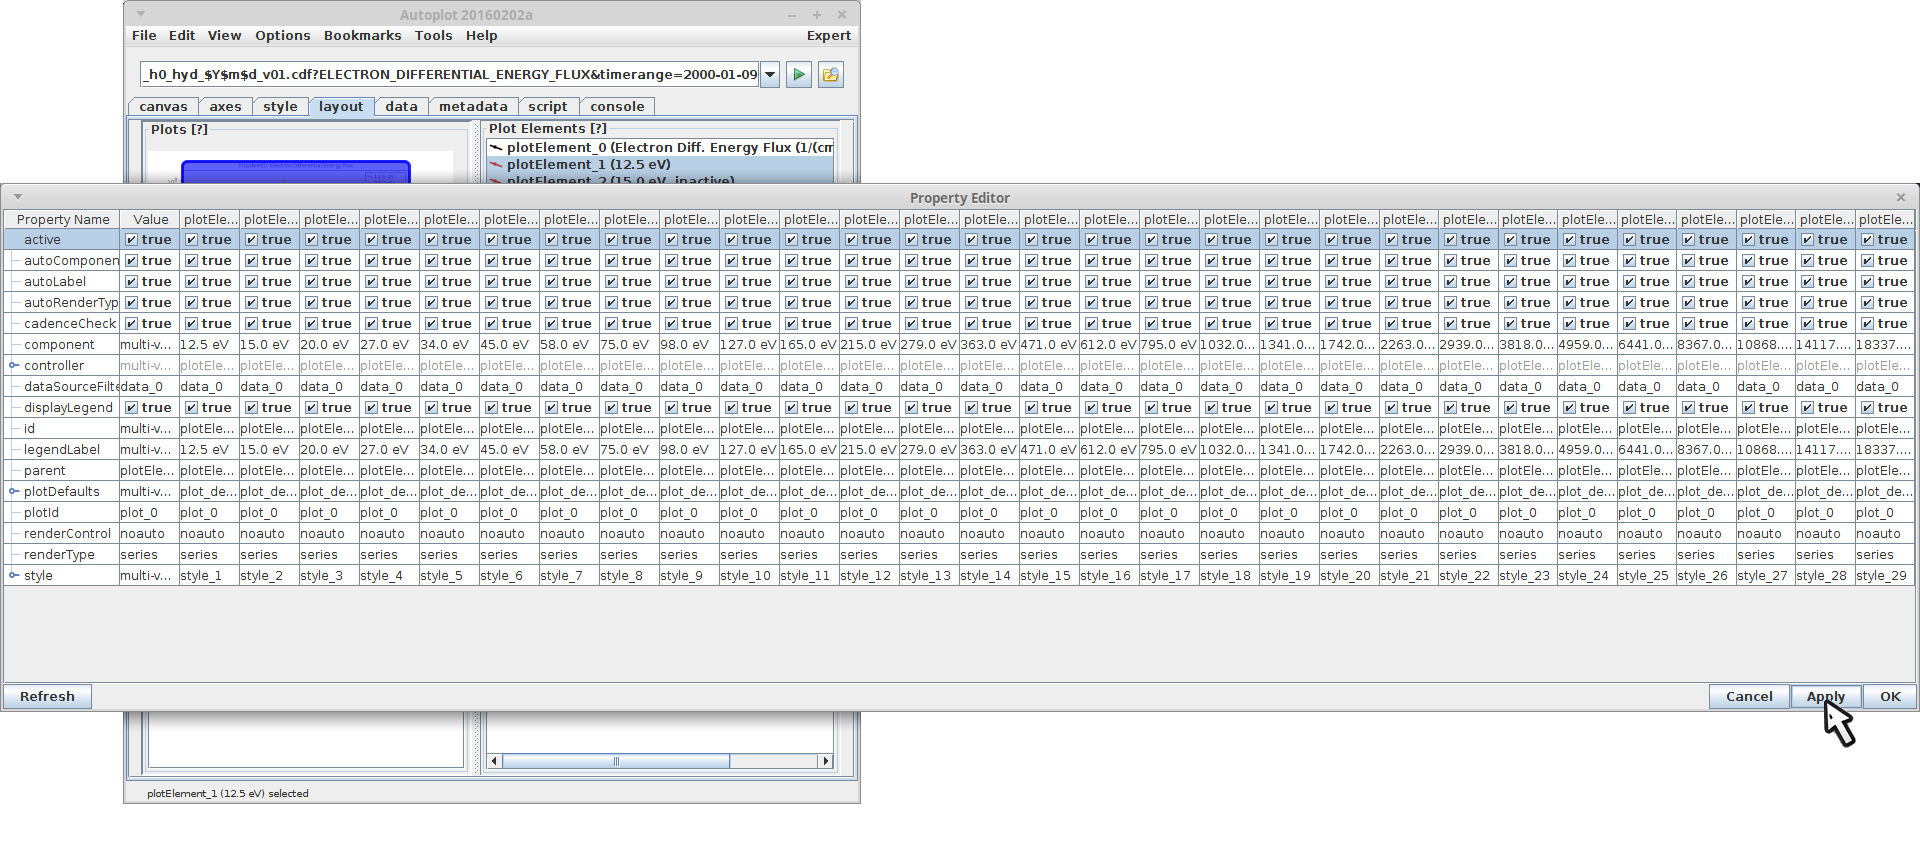
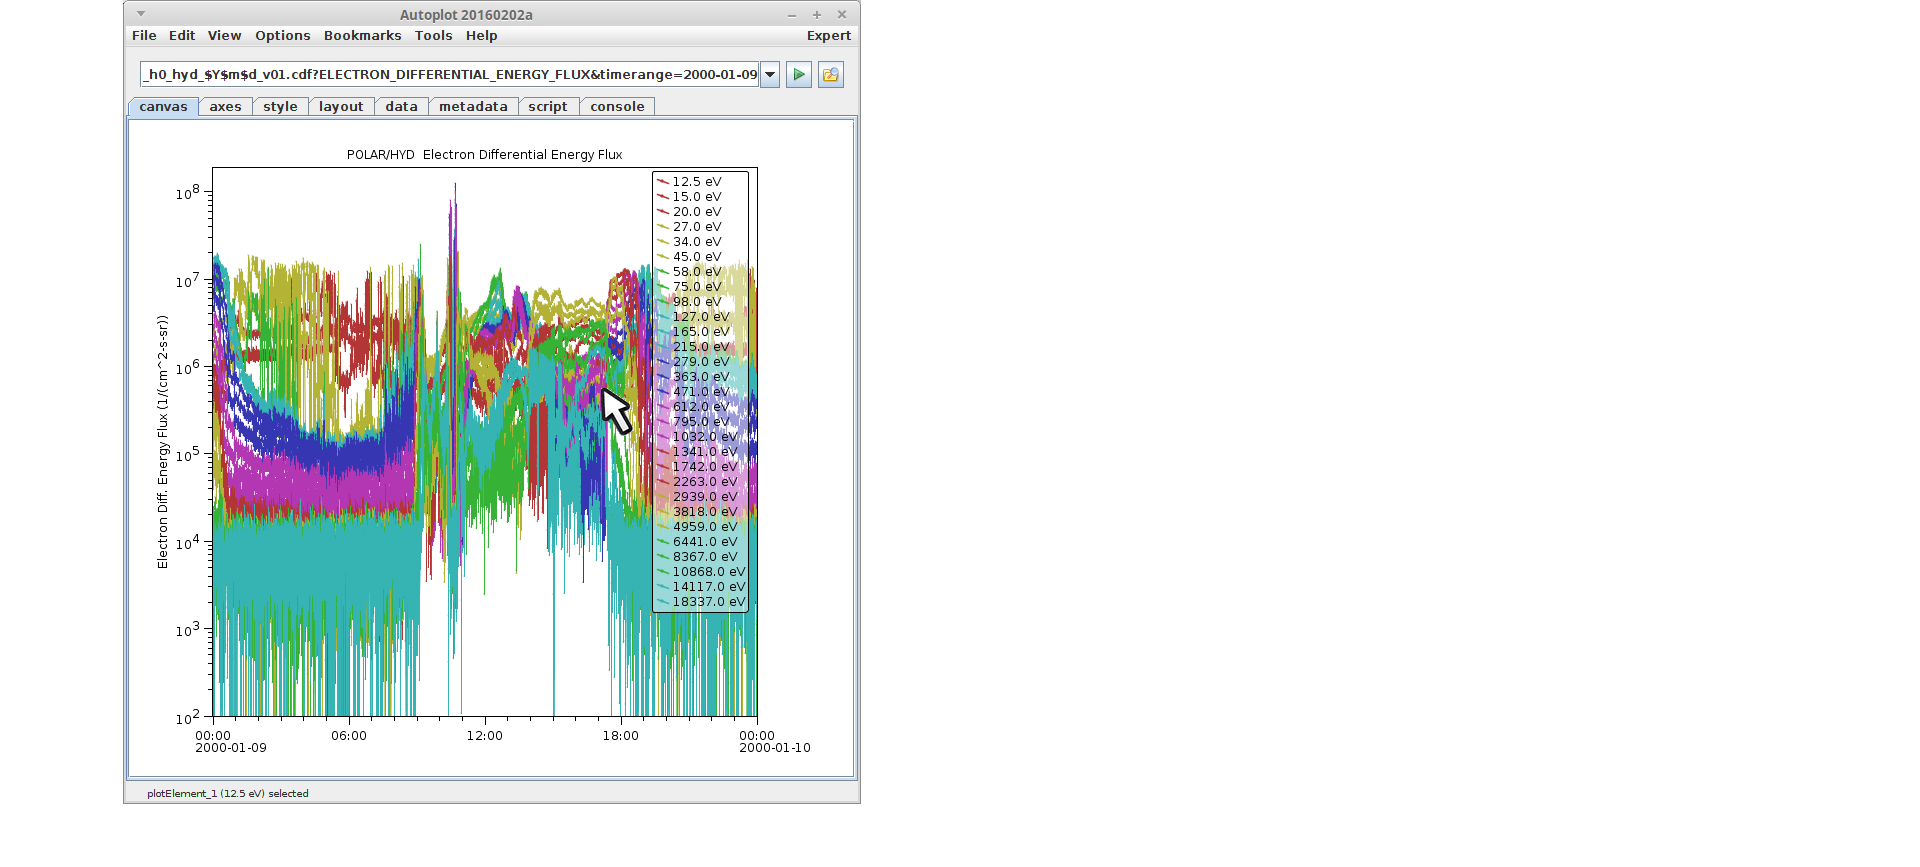
plot demo2, http://cdaweb.gsfc.nasa.gov/istp_public/data/polar/hydra/hyd_h0/$Y/po_h0_hyd_$Y$m$d_v01.cdf?ELECTRON_DIFFERENTIAL_ENERGY_FLUX&timerange=2000-01-09right-click on the spectrogram, plot style, seriesA subset of the plot elements are shown, the reset are not active.layout tab, select all plotElements besides plotElement_0right-click, edit plot element propertiesclick on active, click again to select all"Apply" to apply the changes.All the channels are shown.